Tutorial
A simple registration is required to use this tool. Once registered, you can login anytime with your selected email address and password.
Query Input:
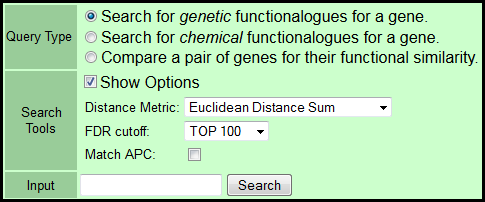
- Select Query Type:
- Search for genetic functionalogs for a gene: Returns the relevant section of the genetic (siRNA+miRNA) cluster (Supplemental Figure 2A) for display of cluster-based relationships together with rank-ordered nearest neighbors of the query gene based on the selected distance or correlation metric.
- Search for chemical functionalogs for a gene: Returns a rank-ordered list of nearest neighbor natural product fractions based on the selected distance or correlation metric.
- Compare a pair of genes for their functional similarity: Returns the user-selected distance or correlation between a gene pair.
- Input: Requires one gene pair separated by a comma and/or whitespace.
(e.g. “AKT1, AKT2”)
- Input: Requires one gene pair separated by a comma and/or whitespace.
- Select a distance or correlation metric from the indicated drop-down menu:
- Euclidean distance sum (default)
- Mahalanobis distance sum
- Euclidean distance rank sum
- Pearson correlation.
- Select a false discovery rate filter (FDR cutoff) from the drop-down menu:
- TOP 100 (default): 100 functionalogs with the lowest p value.
- GET ALL: No filter (only available if APC is matched).
- FDR<0.1
- FDR<0.2
- FDR<0.3
- FDR<0.4
- FDR<0.5
- Select checkbox to return functionalogs that match the queried gene's cluster number determined by Affinity Propagation Clustering (APC) algorithm. APC is only available for metrics:
- Euclidean distance sum (default)
- Pearson correlation
- Input the gene or miRNA symbol of interest.
- Only 1 symbol for functionalog search and 2 for comparison.
- Input requires an appropriate HUGO gene symbol (case insensitive).
- A list of currently queryable gene symbols is here.
Output Description:
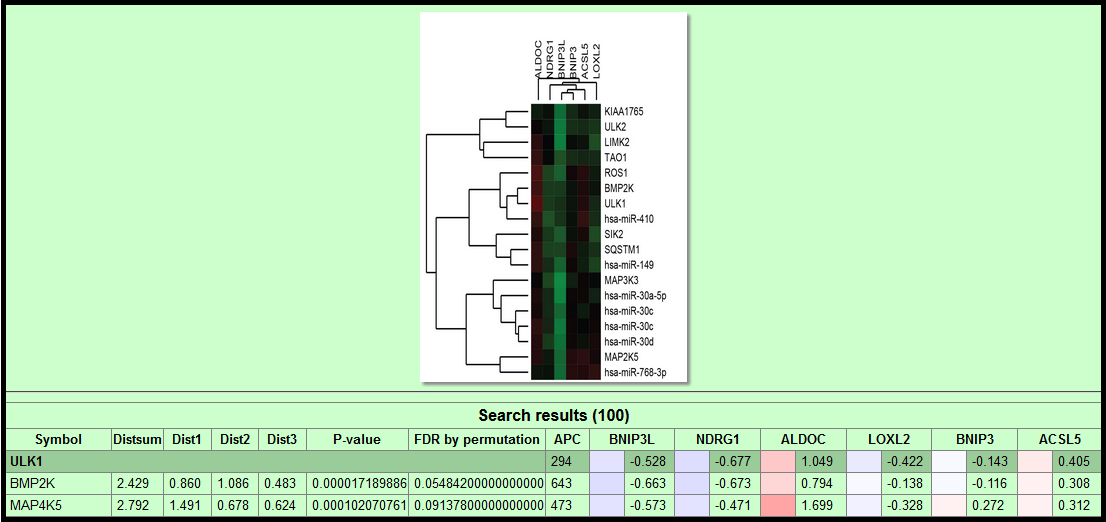
- Associated Subcluster: Heatmap of the subcluster associated with gene of interest. Derived from clustering the complete kinome+miRNA dataset.
- Symbol: Gene symbol or name of the natural product.
- Metric: Sum of triplicate measures (Dist1, Dist2, Dist3).
- Distsum: Euclidean distance sum
- Mahalanobis: Mahalanobis distance sum
- Ranksum: Euclidean distance rank sum
- Pearson: Pearson correlation
- P-value & FDR: Obtained from permuted dataset. FDR value is displayed only when it is less than 0.5. See Supplemental Methods for details.
- APC: Cluster number is determined by the apcluster R package using the specified distance metric.
- BNIP3L, NDRG1, ALDOC, LOXL2, BNIP3, ACSL5: LOG2 transformed normalized gene expression values for each of the 6 reporter genes.
Output Management
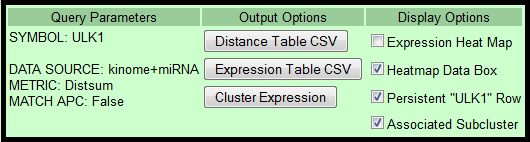
- Query Parameters: Displays search parameters for the current query results.
- Output Options
- Distance Table: Download CSV file containing the distance table (Symbol, Metric, Dist1-3, P value, FDR, APC).
Queried gene data is NOT included. - Expression Table: Download CSV file containing Log2 expression values of functionalogs.
Queried gene expression is included. - Cluster Expression: Hierarchically cluster the Log2 expression results from the current query. Get PDF file.
- Distance Table: Download CSV file containing the distance table (Symbol, Metric, Dist1-3, P value, FDR, APC).
- Display Options
- Expression Heat Map: Collapse gene expression numeric values for quick comparisons.
- Heatmap Data Box: Display text box in lower left corner to display heatmap cell data.
- Persistent Row: Always display queried gene row as you scroll down.
- Associated Subcluster: Display all images of subclusters associated with the gene of interest.